 |
| Notice that PID 14764 |
Since it is obvious that there does exist a window I needed another approach. Next I set a loop running to print the window information every second for the return of GetForegroundWindow.
Great! I now know what to look for to discover the window. Lets just take a look at our processes when sorted by process id...Window Text: World of WarcraftClass Name: GxWindowClassWindowThreadPID: 12336
 |
| Hmmm, there is no 12336 process. |
Update 1: I have downloaded the WinDbg Preview app and tried attaching to process 14764.
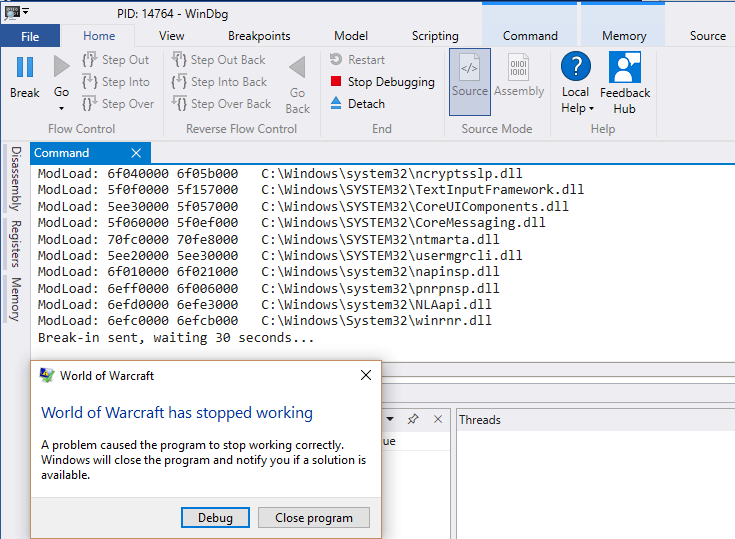 |
| It didn't like that very much. |

 |
| It seems that it said no. |
Update 4: Debugging!
 |
| Crash prior to executable entrypoint |
My first check was to use [sxe ld] to break on dll load, thinking that it might be pulling in a dependent Dll which is causing the crash from the DllEntryPoint. There is no module loads before the crash.
Next I will use the nearly magical Step to Address. I don't care where it steps to, I just want to see what the last function called before the crash is.
- Start at the ntdll!LdrpDoDebuggerBreak breakpoint
- Run the command [pa 1] which causes the debugger to step over until it reaches EIP=1, which will never happen. The last displayed instruction before the crash is our next path down.
- After the step we see that LdrpInitializeProcess calls deeper. There is anti-debugging code abusing TLS initialization.
ntdll!LdrpInitializeProcess+0x1b42: 76fdf7a5 call ntdll!LdrpCallTlsInitializers- This process will be repeated with breakpoints on each call deeper.
- bp ntdll!LdrpCallTlsInitializers
ntdll!LdrpCallTlsInitializers+0x5731d:
77003a92 call    ntdll!LdrpCallInitRoutine
bp ntdll!LdrpCallTlsInitializers "bp ntdll!LdrpCallInitRoutine"ntdll!LdrpCallInitRoutine+0x7a: 76faf30a call ntdll!LdrxCallInitRoutinentdll!LdrxCallInitRoutine+0x13 76fe1cd3 call dword ptr [ebp+8] ss:002b:Wow+0x3fd0ntdll!LdrxCallInitRoutine+0x13 76fe1cd3 call dword ptr [ebp+8] ss:002b:Wow+0x7030- Now I see where the code execution is beginning. This is where I would normally switch to static analysis, but I have not fully set up my home system since the upgrade a few weeks ago. No IDA Pro today.
- Restart again and jump directly to that spot. Remember that `g <address>` or `bp <address>` both patch memory with software breakpoints and I would rather not do so.
- bp ntdll!LdrxCallInitRoutine "ba e 1 Wow+0x7030;gc"
- If OMG verbosity is your thing then you can use the Trace to Address to run to the crash and record everything that happens. This is a very slow process!
- ta 1
- I ran the above command and then wrote the above text. It still has not gotten to the crash yet.
- I bailed out
- Instead I am switching to the [pa 1] trick again.
Wow+0x703f: call Wow+0x7120- This next function has a lot of instructions.
- It has no calls, so [pa 1] and [ta 1] are displaying the same behavior... too damn slow
- As my screenshot though shows, there are first chance exceptions being observed.
- I want to see all first chances... [sxe *]
Unknown exception - code c0000096 (first chance) Wow+0x186c8: 012586c8 hlt- Hlt will do it. That is a privileged instruction.
- And I'm going to stop with this rabbit hole now. The one thing to note is that the crash if different if I slow down execution, so there are multiple anti-analysis techniques in place.
- This route is turning up fruitless as to why can't I properly detect the window as expected.
Last update! Conclusion!
Accessibility code for the win.
def GetRealOwnerProcessId( hwnd ):
    """
        This leverages the 'Active Accessibility User Interface Services Client Function' GetProcessHandleFromHwnd
        It avoids whatever is the problem that keeps GetWindowThreadProcessId from working as expected.
    """
    PH_PID = -1
    ProcHandle = GetProcessHandleFromHwnd(hwnd)
    if ValidHandle(ProcHandle):
        PH_PID = GetProcessId(ProcHandle)
    CloseHandle(ProcHandle)
    return PH_PID
I can now successfully locate the real World of Warcraft process by enumerating the windows.